You’ve got a sense for how your restaurant is doing — you can feel it during a rush or read it in the tickets piling up on the rail. But instinct only gets you so far. When you’re running two, three, or five locations, gut feeling doesn’t scale the way reliable data does.
Restaurant dashboards and reports turn the data you’re already generating — from your point of sale (POS) and your scheduling and time clock systems — into something you can act on. You catch labor cost spikes the day they happen, not at month-end. You see which team members are dropping shifts in plain numbers, without guessing.
The difference between staying profitable and losing margin often comes down to how quickly you spot problems. Dashboards give you that speed, and reports give you the depth to understand why something happened and how to fix it.
Here are seven ways dashboards and reports help you run a smarter operation.
What is a restaurant dashboard?
A restaurant dashboard is a real-time, visual snapshot of your key metrics — all on one screen. Think of it as the cockpit view of your operation: labor cost percentage and sales versus forecast at a glance. It updates throughout the day, so you’re always working with current numbers.
Reports dig deeper. They help you analyze trends over weeks or months and compare performance across locations so you understand why the numbers moved.
Use dashboards to act on current numbers and reports to understand why the numbers moved. When you use both consistently, you catch problems early and keep margins tight.
Key performance indicators (KPIs) every restaurant dashboard should track
Not every number deserves a spot on your dashboard. Focus on the metrics that drive daily decisions and long-term profitability:
- Labor cost percentage: Your total labor spend divided by total revenue. For most restaurants, many operators target 25% to 35% of revenue, though it varies by concept and market.
- Prime cost: The combination of your cost of goods sold (COGS) and total labor. This is the single number that tells you whether your restaurant is making money. Many operators aim to keep prime cost between 60% and 65% of revenue.
- Daily sales vs. forecast: How close are your actual sales to what you projected? Consistent gaps here mean your scheduling and purchasing decisions are based on bad data.
- Overtime hours: Overtime creeps up fast, especially across multiple locations. Tracking it daily — not just at the end of a pay period — lets you adjust schedules before costs spiral.
- Food cost variance: The difference between your actual food cost and your theoretical food cost (what it should be based on recipes, portions, and sales mix). A widening gap points to waste or over-portioning.
- Employee turnover rate: High turnover is one of the most expensive problems in the restaurant industry. Tracking it monthly helps you spot retention issues before you lose your strongest team members.
- Revenue per labor hour: This tells you how much revenue your team generates for every hour worked. It’s one of the clearest measures of scheduling efficiency and can vary widely between your locations.
For a deeper look at the numbers that matter, see this guide to restaurant metrics. These KPIs form the foundation of every section that follows. When you’re tracking the right numbers, the rest of the decisions get easier.
Is your restaurant leaking profit?
Get the free checklist to spot the 7 hidden cost drains hurting your bottom line (and learn how to fix each one fast).
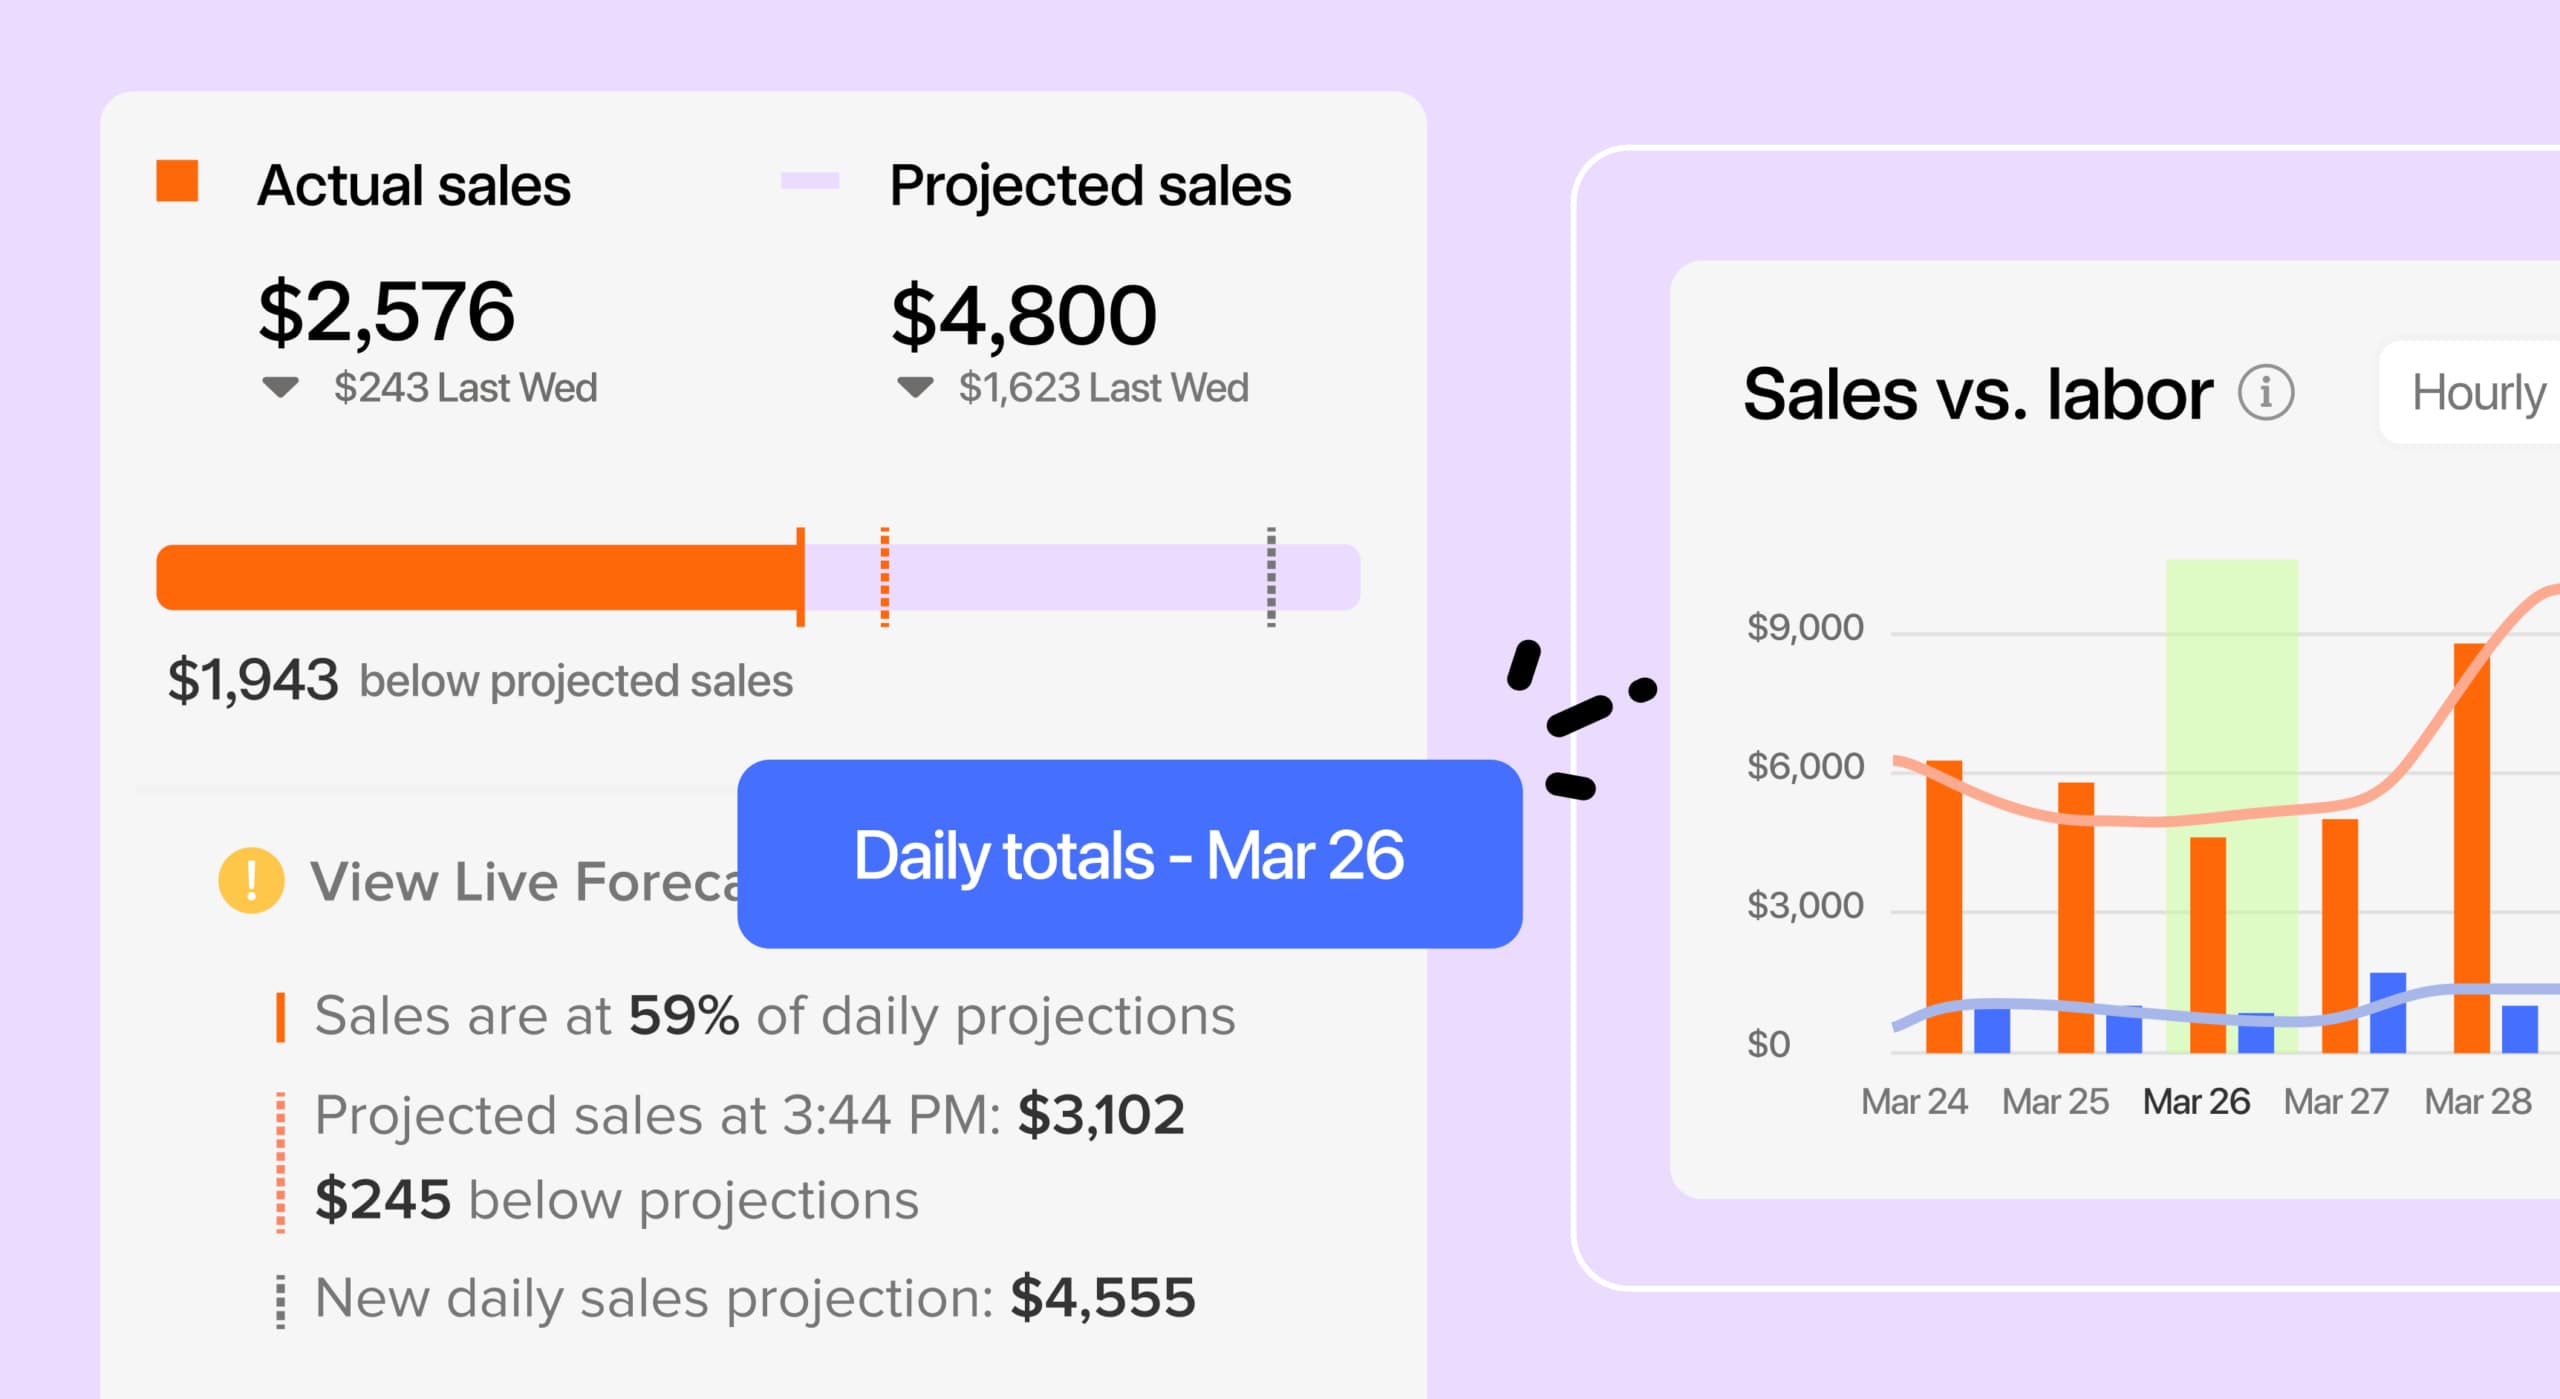
Track actual vs. projected performance
The gap between what you planned and what actually happened is where the real insights live. Variance tracking shows you whether your labor model, sales forecasts, and scheduling decisions are working — or whether you’re leaving money on the table every week.
You can have the most detailed projections, but they’ll never be quite on the nose. Detailed reports on variances between your actual and projected sales and labor uncover gaps in your planning like excess overtime or under-staffing to build more efficient, money-saving shift schedules. When you integrate your POS with your scheduling system, you can pull in actual sales numbers for an up-to-date look at how your restaurant is performing.

With 7shifts’ schedule builder, managers can staff shifts to hit labor targets
Take it from the team at Canyon’s Fresh Grill. Owner Mark Crumpton says his projected-versus-actual sales reports are “almost, if not, they’re 95%. They’re almost spot-on.” Canyon pulls their sales data from their POS to build reports, which they’ve used to cut labor costs up to 15%.
Know which employees you can count on—and who isn’t engaged
Who is your most reliable employee? Who is most likely to call out sick? You may think you know, but the numbers often tell a different story. An employee engagement tool and reports show you the real numbers behind who is always on time and who drops the most shifts.
7shifts allows team members to give their feedback after every shift, which you can see in the engagement report. When you track engagement data regularly, you catch retention issues before they become costly and keep your team engaged.
See exactly where your payroll dollars are going
Restaurant payroll doesn’t always paint the full picture. By creating a detailed report of worked hours and overtime, you can better monitor where you’re spending your labor dollars. You can use these reports to compare worked hours and wages against your schedules and targets to find your biggest gaps.
Look for two signals in your labor reports: overtime trends by location (is one store consistently running over?) and the gap between scheduled and actual hours. If those numbers are off, your scheduling approach needs adjustment.

7shifts’ reporting shows variance across locations at a glance
Track performance on the go
Never miss a labor cost spike or scheduling gap because you weren’t in the restaurant. A mobile manager dashboard lets you track performance on the go and make on-the-fly decisions that reduce your labor costs and protect your margins.
Get a bird’s-eye view of your entire operation
When you run more than one restaurant, you can’t be in every place at once. An Operations Overview Dashboard pulls labor and sales data from every location into one view, so you can compare performance and catch outliers without visiting each one. If you have strict labor targets for each of your locations, the Operations Overview Dashboard helps you hit those KPIs without checking each location individually.
The team at Main Squeeze Juice Co. uses tools like this to manage across locations, saving up to 25% in labor costs in some cases. “I can make adjustments in real time based off of my sales numbers. And it’s right there in front of you, what more could you ask for? It’s like having the best restaurateur in the world, in your ear all day long,” says Jessie Williams, Director of IT at Main Squeeze Juice Co.
Break down labor budgets by department
Sometimes you need more than just a top-level overview. What if the back of house is perfectly staffed, but you have servers hanging out without customers? Department-based budgeting unlocks those insights. You can control how your sales divide and how the system calculates projections for each department in your restaurant, allowing you to more accurately project labor costs and build smarter schedules.
Keep an eye on your team’s overall efficiency
Who did what, and when? 7shifts’ Task Report helps you find your top-performing locations and employees while tracking what’s getting done and what isn’t. Within the Manager Log Book, the Task Summary provides an at-a-glance look at the day’s tasks, which includes a progress tracker and detailed breakdown of what tasks are complete or outstanding. It also adds color to your notes recorded in the Manager Log Book each day. The Task Report and Task Summary show you what’s getting done across every location.

7shifts’ task report
Frequently asked questions
What’s the difference between a restaurant dashboard and a report?
A dashboard is a real-time, visual snapshot of your key metrics — updated throughout the day so you can act on current numbers. A report is a detailed, periodic breakdown that helps you analyze trends over time and understand why something happened.
What reports should be on a restaurant dashboard?
At a minimum, track sales vs. forecast and labor cost percentage. For a full breakdown, explore restaurant reporting features that cover each of these areas.
How do I calculate actual vs. theoretical food cost?
Actual food cost is what you spent on ingredients during a given period. Theoretical food cost is what you should have spent based on your recipes, portion sizes, and sales mix. The gap between the two reveals waste or over-portioning that needs attention.
How can restaurant dashboards help control labor costs?
Dashboards give you real-time visibility into scheduled vs. actual hours and labor percentage by location. That lets you adjust schedules and staffing levels before costs spiral.
How do I track restaurant performance across multiple locations?
Use an Operations Overview Dashboard that aggregates labor and sales data from all your locations into one view. This lets you compare performance side by side and spot outliers without visiting each location individually.
Run a smarter operation with the right data
When you have dashboards for daily decisions and reports for deeper analysis, you have the information to protect your margins and support your team.
7shifts gives you the restaurant reporting features you need to see what’s happening across every location and every shift. Start a free trial and see how the right data changes the way you run your operation.

Rebecca Hebert, Sales Development Representative
Rebecca Hebert
Sales Development Representative
Rebecca Hebert is a former restaurant industry professional with nearly 20 years of hands-on experience leading teams in fast-paced hospitality environments. Rebecca brings that firsthand knowledge to the tech side of the industry, helping restaurants streamline their operations with purpose-built workforce management solutions. As an active contributor to expansion efforts, she’s passionate about empowering restaurateurs with tools that genuinely support their day-to-day operations.